
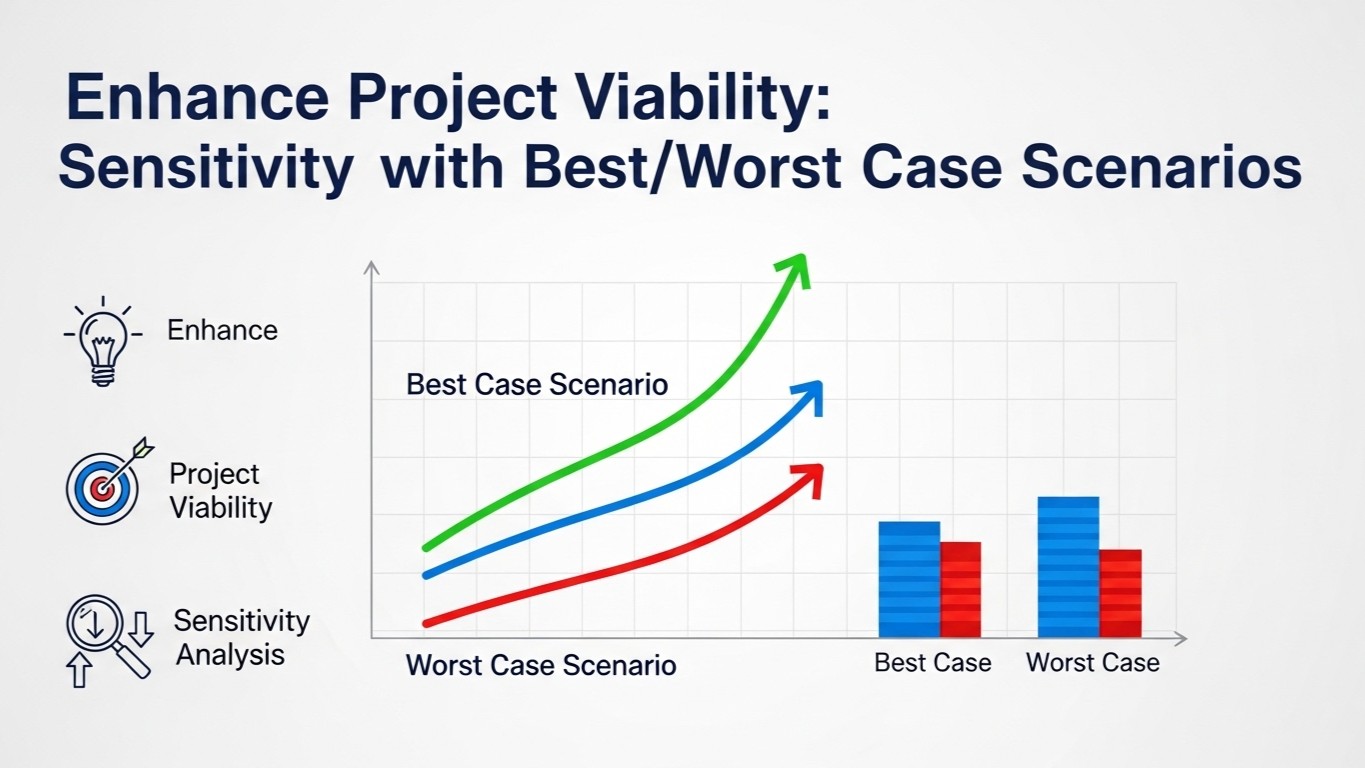

What sensitivity analysis does for a project
A base-case projection is one view of the future built on a set of assumptions. Sensitivity analysis asks a harder question: what happens if an assumption is wrong? By varying a key input and recalculating the statements, you can see how much the project's outcome depends on that input, and how much room there is before the outcome becomes unacceptable.
In a bank-loan project the outcome that matters most is the ability to service debt. A sensitivity study therefore watches DSCR, break-even sales, net profit, cash flow and the key financial ratios, because those are the numbers a credit team tests during appraisal.
Why best-case and worst-case scenarios help
A range of outcomes is easier to act on than a single point. A worst case shows the downside the promoter must be able to survive: the sales level at which DSCR still covers the repayment, and the point at which the business would need extra support. A best case shows the upside and the capacity it implies, which helps in planning later phases of investment. Three scenarios, a base case with a best case and a worst case beside it, give the reader the shape of the risk without a mass of tables.
Step-by-step: adding sensitivity to a project report
Step 1: Identify the variables that matter
Not every assumption deserves a scenario. Focus on the few that carry the most weight and the most uncertainty, such as:
- Sales volume and capacity utilisation
- Selling price and discounting
- Raw material and input costs
- Power, fuel and wages
- Interest rate on the proposed borrowing
- Project cost overrun and the time taken to complete
- The collection period from customers
For a manufacturing unit, input cost and utilisation usually move the result the most. For a service business, the billing rate and the time taken to collect are often the sensitive pair.
Step 2: Set the best-case and worst-case values
Each scenario should be a realistic extreme, not an arbitrary one. Use historical cost data, supplier quotations, market trends and the experience of similar units to fix the range, and write down where each value comes from. A worst case that cannot happen is of little use, and an optimistic best case undermines the credibility of the whole report.
Step 3: Run each scenario through the statements
There are two ways to vary the inputs. In a single-variable sensitivity, one assumption is changed at a time while the rest stay at base, which shows exactly which input drives the result. In a scenario, a group of assumptions moves together in a consistent story, for example a demand slowdown that lowers both volume and price while leaving costs largely intact. Running both gives the bank a clear picture of the project's exposure.
Step 4: Read the impact, not only the outcome
Compare DSCR, break-even sales, net profit and cash flow across the three cases. Note which input moves the result the most, and the margin available before a covenant is breached. A project whose worst case still services the loan is easier to sanction than one that is comfortable only in the base case.
Step 5: Record the assumptions and the response
Keep the scenario table, the assumptions behind it and the proposed responses in the report. Mitigation can be practical rather than financial: phasing the capital expenditure, keeping a longer moratorium, building a contingency into the project cost, or arranging a slightly larger working capital limit than the base case needs.
Scenario analysis, sensitivity analysis and stress testing
The three terms are related but not identical. Sensitivity analysis changes one input at a time. Scenario analysis moves a consistent group of inputs together to tell a story such as a price war or a poor monsoon. Stress testing pushes the project into an extreme but still plausible adverse case, often to see whether repayment survives. A project report for a bank loan usually carries all three, presented in a single section with the methodology explained in a short paragraph.
Presenting sensitivity findings in the report
A compact table does the work best. One row per scenario, with the key assumption on the left and the resulting DSCR, break-even sales, net profit and cash flow across the columns, tells the story at a glance. Under it, a short note on the method and the most sensitive variables, then a paragraph stating whether the project remains viable in the worst case and what would be done if that case occurred.
Finxora's CMA report software computes sensitivity analysis and break-even analysis for the projected years as part of the standard CMA pack, alongside the operating statement, MPBF computation and ratio analysis. For a new unit or an expansion, the project report software builds the projected statements, DSCR, break-even and ratio analysis from the same inputs, so a change to a sales or cost assumption updates every statement together. A filled sample report shows the layout these pages print in.
Sensitivity analysis when the business is already running
A renewal or an enhancement request is not judged on projections alone. The bank already holds the audited accounts and compares the projected figures with what the business actually achieved. A projection that assumes a sudden improvement in margin, with no stated reason, tends to attract questions. Running the same best-case and worst-case exercise against the last three years of actual performance gives the promoter a realistic base case, and shows the bank that the assumptions sit close to observed trend.
It also helps to test the working capital part of the request. A change in the collection period or in stock holding changes the assessed working capital requirement, and therefore the limit, even when sales stay unchanged. Looking at those inputs beside sales and price completes the picture.
Common mistakes to avoid
- Running a worst case so severe that no project could survive it, which teaches the reader nothing.
- Varying every assumption at once, so no one can tell which one caused the swing.
- Testing only the profit and loss account while ignoring working capital and cash flow.
- Using last year's input costs in the base case after a known price increase.
- Leaving the scenario assumptions out of the report, so the numbers cannot be checked.