
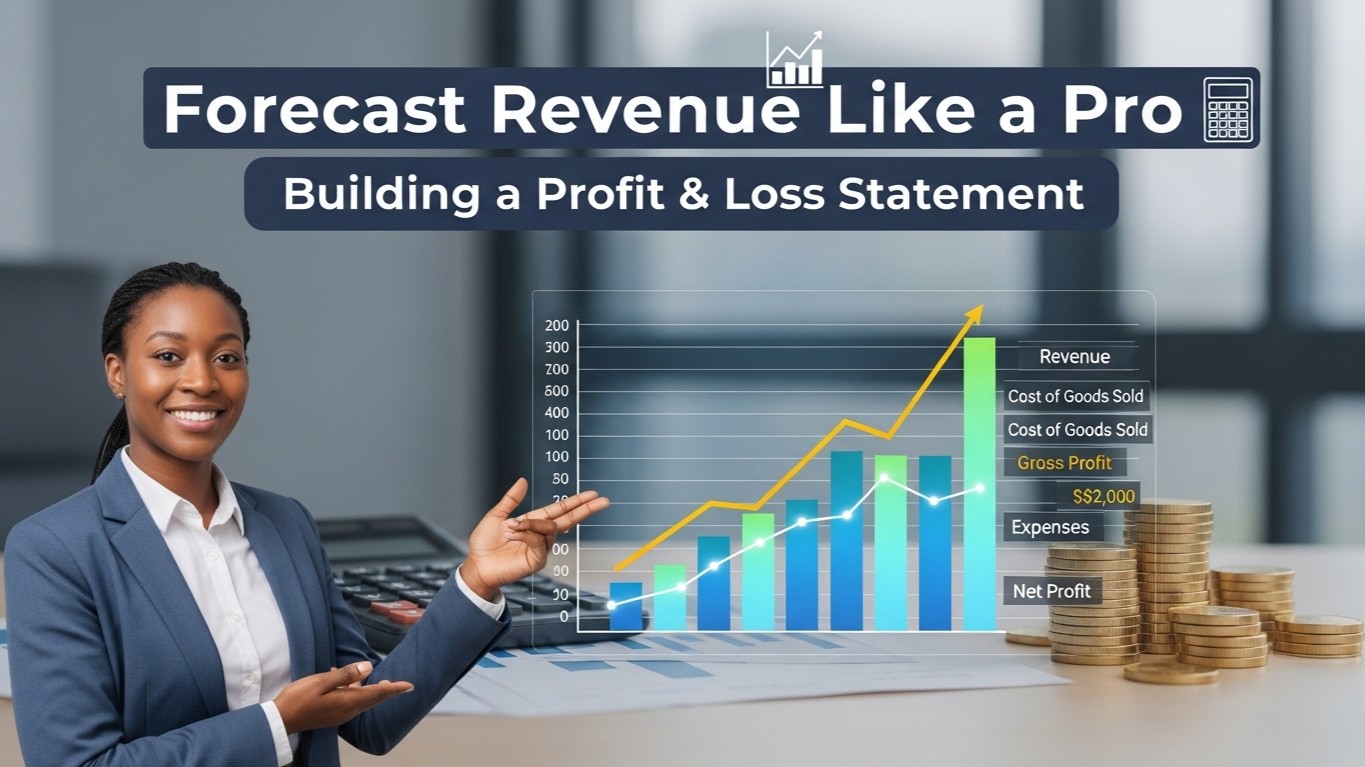

Understanding the Projected Profit and Loss Statement
The projected profit and loss statement, also called an income statement, forecasts a company's financial performance over a specific period. Unlike historical statements, which reflect past results, the projected version looks forward, estimating revenue, expenses and net profit or loss. This forecast is essential for planning, securing funding and making informed decisions.
Lenders and investors often require projected P&L statements to assess the viability of a business and its ability to repay loans or generate returns. By comparing actual results against the projection, a business can spot where it is exceeding or falling short and take corrective action.
Why a Projected P&L Matters
Planning: it helps set realistic goals and develop strategies to achieve them.
Funding: lenders and investors use it to judge viability and repayment capacity.
Performance monitoring: comparing actuals to projections highlights gaps early.
Decision making: it informs pricing, production, marketing and other key choices.
Key Components of a Projected P&L
A typical projected P&L includes the following components:
1. Revenue
Revenue is the total income from the sale of goods or services. Forecasting revenue is the most critical step, because it underpins every other projection. Common methods include:
Sales history analysis: analysing past sales data to identify trends and patterns.
Market research: assessing market size, growth potential and share.
Bottom-up forecasting: building from unit volumes and prices.
Top-down forecasting: starting from market size and applying a share.
2. Cost of Goods Sold
COGS covers the direct costs of producing goods or services: materials, direct labour and manufacturing overhead. Subtracting COGS from revenue gives gross profit.
3. Gross Profit
Gross Profit = Revenue minus COGS. It shows how efficiently the core business produces value before operating costs.
4. Operating Expenses
These are the costs of running the business: salaries, rent, marketing, depreciation and administrative costs. They are usually split into selling and administrative expenses.
5. Operating Income (EBIT)
Operating Income, or Earnings Before Interest and Taxes, is gross profit minus operating expenses. It measures the profit from core operations before financing and tax.
6. Interest Expense
Interest on debt is deducted next, reflecting the cost of borrowing.
7. Income Before Taxes (EBT)
EBT is operating income minus interest expense. Tax is applied to this figure to arrive at net profit.
Forecasting Techniques That Improve Accuracy
Accuracy comes from combining methods rather than relying on one. Use historical data to establish a baseline, then adjust for known changes: new products, price changes, capacity additions, or market shifts. Build scenarios, at least a base, upside and downside case, so the range of outcomes is visible. Document the assumptions behind each line, because a projection without stated assumptions cannot be reviewed or updated.
Handling Seasonality
Many businesses earn unevenly across the year. Spreading revenue flatly across twelve months hides the real pattern and distorts working capital and cash flow. Where the business is seasonal, project revenue by month or quarter, and let costs follow the activity. This matters for crop, festival and monsoon-dependent businesses, and for a first year starting mid-way.
Common Mistakes to Avoid
Over-optimistic revenue growth is the most common error. Base growth on evidence, not hope. Underestimating costs, especially overhead that grows with scale, is the second. Ignoring the link between the P&L and the balance sheet and cash flow leads to figures that do not reconcile. And building a single scenario gives a false sense of certainty.
From P&L to the Wider Report
A projected P&L rarely stands alone. Banks and investors read it alongside the projected balance sheet, cash flow, depreciation, debt service and ratios. For a bank loan, the P&L feeds into DSCR, break-even and the overall appraisal. Tools that build these statements from the same inputs keep the figures consistent. Finxora's balance sheet software produces the Trading and Profit and Loss Account, capital account, depreciation schedule and ratio analysis from one set of inputs, exported as PDF, Word or Excel. Review the balance sheet software page, pricing, or samples before deciding. General-purpose utilities are listed on the tools hub.
Revenue Forecasting Methods in Detail
Choosing the right method depends on data availability and business maturity. A mature business with years of data can use time-series analysis, decomposing revenue into trend, seasonality and residual components. A new business with no history must rely on market sizing and bottom-up assumptions. Most established firms use a hybrid: time series for the base, adjusted for known changes such as new contracts or price revisions.
Sensitivity and Break-Even
Once the P&L is built, test how sensitive profit is to changes in price, volume and cost. A small change in price can have a large effect on profit when margins are thin. Break-even analysis, the sales value at which the unit covers fixed and variable costs, shows the floor the business must clear. Presenting break-even alongside the projection gives readers a sense of how much room for error exists.
Review and Update Cadence
A projection is a living document. Compare actuals to projections monthly or quarterly, investigate variances, and update the forecast. Rolling forecasts, which always look the same distance ahead, are more useful than fixed annual budgets for businesses in changing markets. Keep the original projection on file so the quality of forecasting itself can be measured over time.
Conclusion
Building a projected P&L is a discipline, not a one-off exercise. Start with revenue grounded in evidence, derive costs carefully, link to the balance sheet and cash flow, and document assumptions. Reviewed and updated regularly, the projection becomes a genuine planning tool rather than a document prepared only for the bank.